Windows Server 2012 and later includes powerful automatic deduplication capabilities that can save considerable amounts of disk space. This article will demonstrate the use of FolderSizes to analyze disk space on volumes with data deduplication services enabled.
About Windows Data Deduplication
Windows data deduplication works by analyzing files and segmenting equal portions of their contents into "chunks", which are then moved into a "System Volume Information\Dedup" folder on the corresponding NTFS partition. After data duplication has been applied, the original qualifying data files are replaced by pointer files that resolve to the new consolidated data store. And since these original files no longer contain actual data, they will generally have a "size on disk" of 0 bytes.
You can learn more about Windows data deduplication capabilities and requirements on MSDN.
Size vs. "Size on Disk"
Before proceeding further, it's important to understand that both FolderSizes and Windows are capable of reporting two different file system object size metrics:
- Size - A measurement of the amount of data contained by the file system object.
- Size on Disk - The actual amount of space consumed by the file or folder. FolderSizes calls this the allocated size. This value may be larger or smaller than the reported size after taking various factors such as cluster overhang and compression into consideration.
Windows can only report size metrics for files, but FolderSizes can - of course - report on the cumulative size (and allocated size) of folders as well (in addition to providing many other disk space analysis capabilities). FolderSizes also uses highly specialized algorithms for computing these metrics that results in an unparalleled level of accuracy.
Now let's run some tests to see how FolderSizes reports and visualizes disk space information for deduplicated volumes.
Configuring Our Test Environment
For the purposes of this article, we have created a new local volume (designated as drive letter E:) in our Windows Server 2012 test environment and installed Windows data deduplication services. However, we haven't yet enabled deduplication on our E: drive.
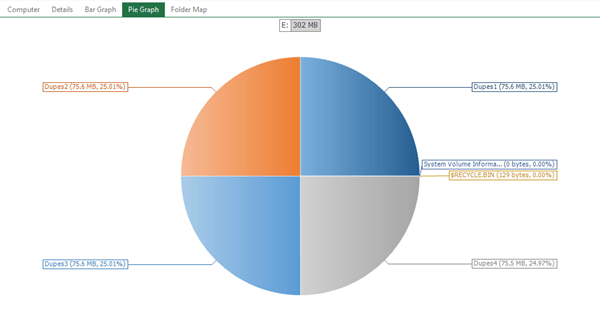
Next, we created a series of four folders on drive E:, each containing an identical set of files. The screenshot below shows the allocation of drive space before deduplication was enabled. As you can see, each of the duplicate folders consumes an equal amount of disk space.
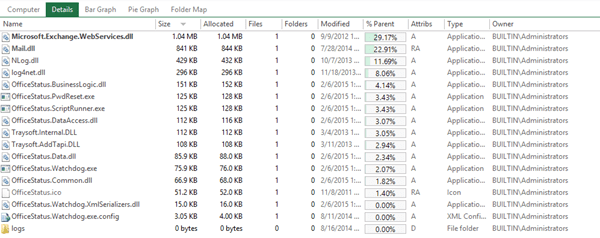
Let's also take a look at an arbitrary set of files within one of these duplicate folders. Again, we haven't yet enabled data deduplication so everything pretty much looks like what you'd expect at this point.
Turning On Data Deduplication
Now we'll actually enable data duplication on our E: drive. We do this in the File and Storage Services section of Windows Server Manager by right-clicking our E: volume and selecting Configure Data Deduplication. We configure data deduplication for "general purpose file server" usage and instruct it to deduplicate files older than 0 days (so our test files will be affected as soon as possible).
Finally, we drop to PowerShell and issue the following command to start the deduplication process immediately:
Start-DedupJob -Volume E: -Type Optimization
A few moments later, deduplication of the files in our test environment is complete.
Visualizing The Results
Now we'll return to FolderSizes, navigate to the E: drive, and click the refresh button (to the right of the path location bar) in order to update our analysis. Here's what the pie graph now shows:
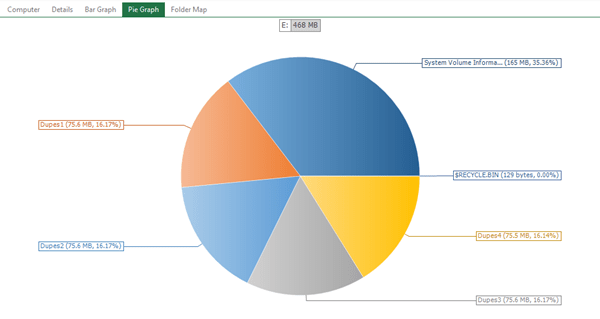
But wait a second, something doesn't seem quite right here. Our duplicate folders are still showing the same size (around 75 MB each) in addition to a large increase in the size of the System Volume Information folder (which, as we noted above, now stores the consolidated duplicate file chunks). So what went wrong?
Actually, nothing went wrong. By default, the chart views within FolderSizes visualize file system objects by size rather than allocated size (or size on disk). And since Windows still reports the original size of deduplicated files, that's what this chart is showing us.
The solution is simple. Navigate to the Graph tab of the main window ribbon bar and click the Show Allocated button.

Now we get a view of our newly deduplicated E: drive that's more consistent with our expectations.
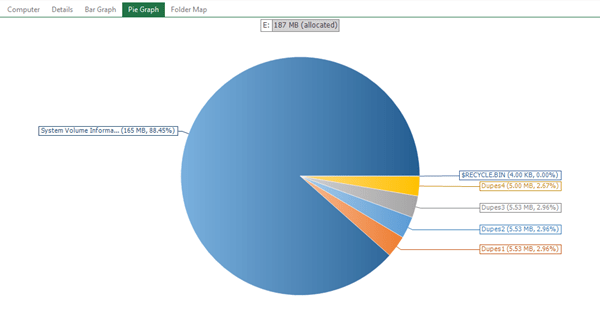
The pie graph now shows that our original duplicate folders consume a much smaller amount of disk space than they did prior to deduplication, while the System Volume Information data chunk store has grown considerably. It also shows a much smaller overall amount of disk space in use - 187 MB vs. the original 468 MB. Of course, real-world savings will differ from those of our contrived test, but this is a good indication that Windows data deduplication is working the way we expect.
While we're at it, let's also take another look at the file listing that we showed you earlier.
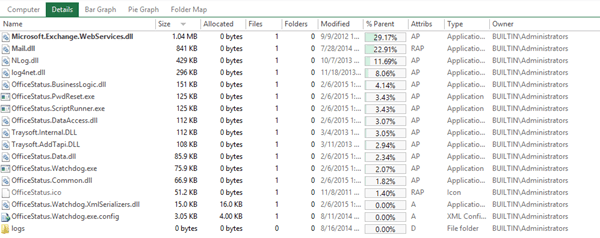
Note that for files affected by the deduplication process, FolderSizes now shows an allocated file size of 0 bytes. You may also notice that the attributes associated with the files has also changed - the attribute strings now contain the letter "P", indicating that these are now sparse files. Using sparse files here allows Windows to control the reported disk space for objects while also limiting allocated disk space.