A NEW PERSPECTIVE ON DISK SPACE
Visualize Disk Space with Sunburst Charts
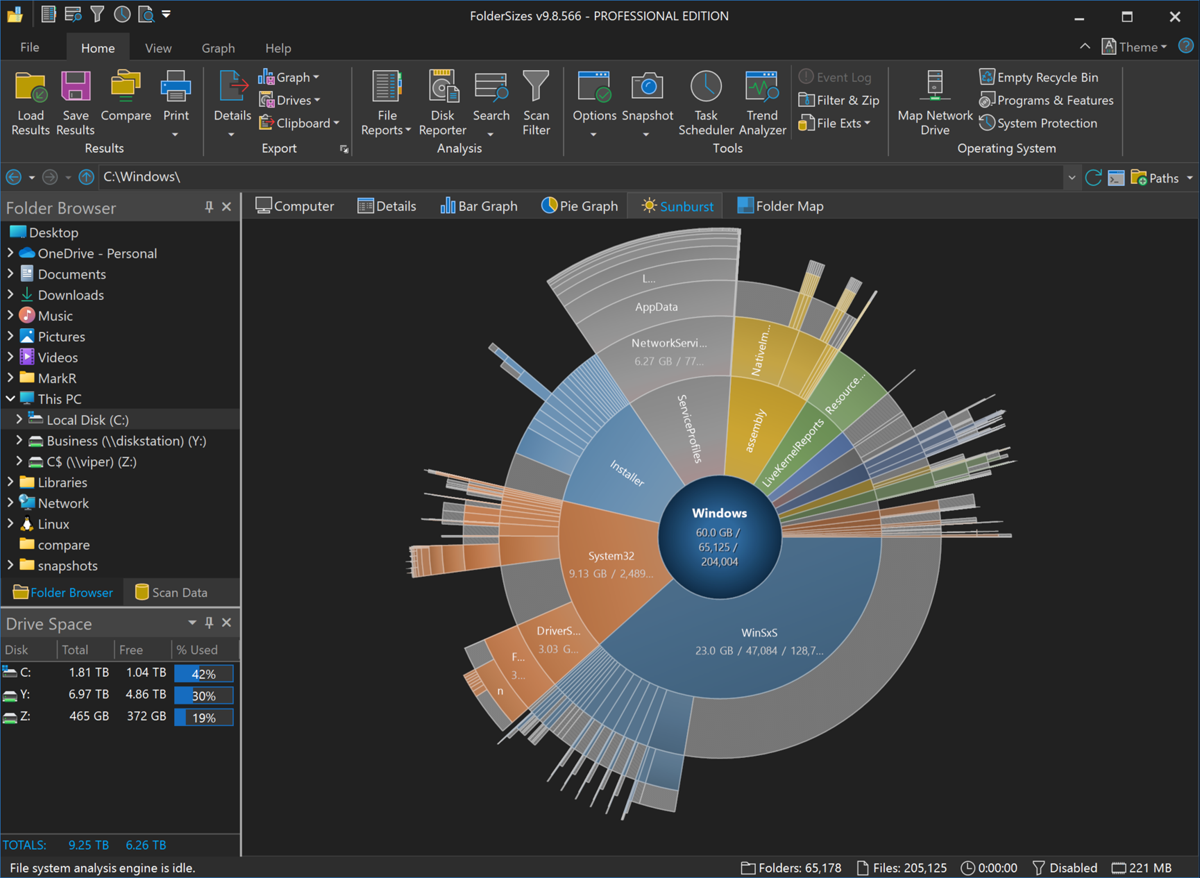
FolderSizes offers a beautiful way to visualize your disk space usage with the sunburst chart. This innovative visualization technique allows you to see your entire storage ecosystem at a glance, making it easier to identify large folders, understand their relationships, and make informed decisions about storage management.

The Sunburst Chart provides a clear and intuitive way to visualize your disk space usage. You can easily see which folders are consuming the most space, and how they relate to each other. This makes it easy to identify large folders that may be candidates for cleanup or archival.
Visualize Your Entire Storage Ecosystem
The Sunburst Chart is a hierarchical visualization that represents your file system as a series of concentric circles. Each circle represents a folder, with the size of the circle corresponding to the amount of disk space it consumes. The inner circles represent parent folders, while the outer circles represent subfolders and files. This layout allows you to see the entire structure of your storage system in one compact view.
Drill Down To See More Detail
The Sunburst Chart is not just a static image; it's an interactive tool that allows you to drill down into your storage system. By clicking on any circle, you can zoom in to see the contents of that folder in greater detail. This drill-down capability allows you to navigate from a high-level overview to specific problem areas with just a few clicks.
With the powerful sunburst visualization in FolderSizes, you'll gain unprecedented insight into your storage environment, making more informed decisions about storage management and optimization. Download the free trial today and see your disk space in a whole new light.